The AI Portfolio rebalances this Wednesday after a period that beat the S&P 500 again, and our new Leveraged ETF forecast just called nine of ten moves correctly.
I Know First Weekly Newsletter | August 16th, 2026
Good day, I Know First Universe!
Read Here:The AI Portfolio Rebalances Wednesday: +45.37% vs S&P 500 +37.65% Since Inception
Read Here:Leveraged ETFs Forecast Based on Deep Learning: Returns up to 7.85% in 3 Days
ARK ETF Stocks Forecast Portfolio Based on a Self-Learning AI Algorithm: Returns up to 14.49% in 3 Days
Top Technology Stocks Based on Genetic Algorithms: Returns up to 27.91% in 7 Days
Quantitative Trading Based on Deep Learning: Returns up to 32.58% in 14 Days
Tech Stocks Based on a Self-Learning Algorithm: Returns up to 39.26% in 1 Month
Home Builders Stocks Based on Machine Learning: Returns up to 42.26% in 3 Months
SOXX Stocks Based on Deep Learning: Returns up to 681.89% in 1 Year
This Week's Article Picks: Return Since Pick Date
Taiwan Semiconductor (TSM)
+6.83%
PayPal Holdings (PYPL)
+38.94%
Adobe Inc (ADBE)
+29.41%
Taiwan Semiconductor (TSM) is up 6.83% sinceJuly 27th, 2026,as high-performance computing now accounts for 66% of quarterly revenue and full-year 2026 growth is tracking slightly above 40%, with our discounted cash flow model putting fair value at $471.46 per ADR on the strength of its lead across the 2nm through 5nm nodes.
PayPal Holdings Inc (PYPL) is up 38.94% sinceJune 29th, 2026,as PayPal resets its growth strategy around branded-checkout stabilization and Venmo monetization, with our algorithm showing a high signal on the one-year outlook even as the stock trades well below its DCF fair value.
Adobe Inc (ADBE) is up 29.41% sinceJune 12th, 2026,on Adobe's recurring subscription model and successful generative AI integration into its creative workflows, which support a case for undervaluation even after this run.
The AI Portfolio Rebalances This Wednesday: +45.37% Since Inception
Period 18 closes on August 19, when the algorithm selects the next ten positions from scratch. It has been a strong cycle, and Microsoft, one of the names the algorithm held, contributed a 27% gain over the stretch.
The current period, July 22 to August 19, is up 5.80% against 4.09% for the S&P 500.
Since inception the portfolio is up 45.37% against 37.65% for the S&P 500, a 7.72 point premium.
Eighteen rebalance periods completed or in progress since April 2, 2025, tracked with no exclusions.
Ten stocks and ETFs per cycle, equal weighted, selected entirely by the algorithm and held for roughly 28 days.
A live and documented track record, not a backtest.
Joining before Wednesday means starting with a full fresh cycle rather than stepping in midway through one. Read More:
Between Greed and Fear: How AI Strikes the Balance for Good Generalization
Every forecasting model faces the same tension a human investor does: fit the data too closely and you have memorized noise, hold back too much and you have learned nothing. This piece walks through the specific techniques that keep our algorithm on the right side of that line.
Greed in a model is overfitting, capturing every nuance of the training data. Fear is underfitting, refusing to commit to a pattern at all.
Principal component analysis isolates the high-variance signal and strips the noise, so the model is not distracted by irrelevant features.
L1 and L2 regularization constrain complexity, one by forcing weak coefficients to zero, the other by shrinking their magnitude.
Genetic feature evolution shuffles and recombines feature subsets, tests them against added noise, and keeps only what survives.
Ensemble methods let many independent models vote, weighted by track record, so no single failure carries the forecast.
No one technique produces a robust model, and the reliability comes from making all of them argue with each other. Read More:
How Hedge Funds and Family Offices Use I Know First, and the Performance Behind It
Institutional clients do not use the daily forecasts the way a retail subscriber does, and this piece sets out exactly how they do use them. It also puts the full performance record on the table rather than a selected window of it.
Funds use the daily signal and predictability readings across 13,500 assets for idea generation, screening and systematic strategy construction.
The Combined Long/Short Strategy returned 756% since January 29, 2020, against 129.1% for the S&P 500, a compound annual growth rate of 39.7%.
In 2022 the strategy gained 15.36% while the S&P 500 fell 19.95%, and in 2020 it drew down 9.71% against 33.92% for the index.
A Sharpe ratio of 1.72 and a Sortino ratio of 2.68 over the full period.
A J.P. Morgan 2025 survey put active AI use among hedge funds at 46%, up from 18% a year earlier.
Engagements run on a licensing or revenue-share basis, so the model scales with the strategy rather than with headcount. Read More:
Stock Market Forecast: The Top 10 Strategy
The Top 10 Strategy reads a market regime signal continuously and decides whether conditions favor offense or defense before it decides what to hold. The allocation flips with the regime rather than with the calendar.
In bullish conditions it holds 75% in the top five S&P 500 stocks at 15% each, with the remaining 25% in SPY or RSP by signal strength.
In bearish conditions it shifts to 25% in Russell 1000 names with the weakest signals at 5% each, and 75% into RSP or SPY defensively.
Total return of 438.29% from July 2020 through March 15, 2026, exceeding the S&P 500 by 46.09 points.
A Sharpe ratio of 1.71 and a Sortino ratio of 2.54 over that period.
Roughly five years and eight months of history, long enough to cover more than one regime.
The rebalance is scheduled, but the directional signal is monitored every day in between. Read More:
BKNG Stock Forecast: What Is the Current Value of Global Travel?
Booking Holdings runs a capital-light platform that converts revenue into free cash flow at a rate very few businesses of its size manage. Our discounted cash flow work asks what that engine is actually worth once you discount it honestly.
The model puts intrinsic value at $215.70 a share, implying 21.5% upside from the July 24, 2026 close of $177.46.
FY2025 delivered $26.917 billion in revenue and $9.087 billion in free cash flow.
The model assumes 13.0% constant revenue growth across FY2026E through FY2030E.
A discount rate of 11.12%, built from the risk-free rate plus beta times the market risk premium.
Roughly 76.5% of enterprise value sits in terminal value, so small changes to the perpetual growth assumption move the answer a lot.
The algorithm shows a bullish signal across every forecast horizon, and the piece closes with a Buy or Accumulate rating on a 12 to 24 month view at a high risk classification. Read More:
The S&P 500 rose 0.36% this week, closing at 7,785.76. The Nasdaq added 0.14% and the Dow actually fell 0.56%, while the Russell 2000 climbed 1.12%. The VIX drifted down to 14.25, its lowest close of the past month.
Read the headline number and you would conclude nothing happened. That reading would be wrong. A week where the small-cap index moves three times as far as the S&P 500 and the Dow moves the other way entirely is not a quiet week. It is a week where the index cancels itself out and the movement all sits underneath, in the individual names. That is precisely the market where a benchmark tells you the least and asset-level forecasting matters the most.
This is a good moment, then, to show you something new we built for exactly that problem.
The Leveraged ETF Package, Live and On the Record
We introduced the Leveraged ETF package two weeks ago. It maps leveraged and inverse instruments onto securities the daily forecasts already cover, 91 stocks, 8 indexes and sectors and 3 commodities across 11 issuers, from 3x long through 3x short. It does not change the forecast. It changes how precisely you can express one.
Its first published forecast is now closed and public, and I want you to see it rather than take my description of it. Over the three sessions from August 13 to August 16, the deep learning forecast covering 20 leveraged ETFs, 10 long and 10 short, returned up to 7.85% on RCAT, with NBIS at 7.13% and SMCI at 5.93%. The package averaged 2.51% against 0.48% for the S&P 500 over the same three days, a 2.03 point premium. Nine of the ten names moved in the direction the algorithm predicted.
Look again at that S&P 500 figure. The index moved 0.48% across those three sessions. The package moved 2.51%. In a flat tape, direction on the right individual names is the entire return, and the leveraged instruments are simply the tool for expressing that direction with precision. I will say the obvious thing plainly, because it is important: these instruments reset daily, their gearing compounds against you in a choppy market, and they are not suitable for every investor or every signal. The package notes say so, and so do I.
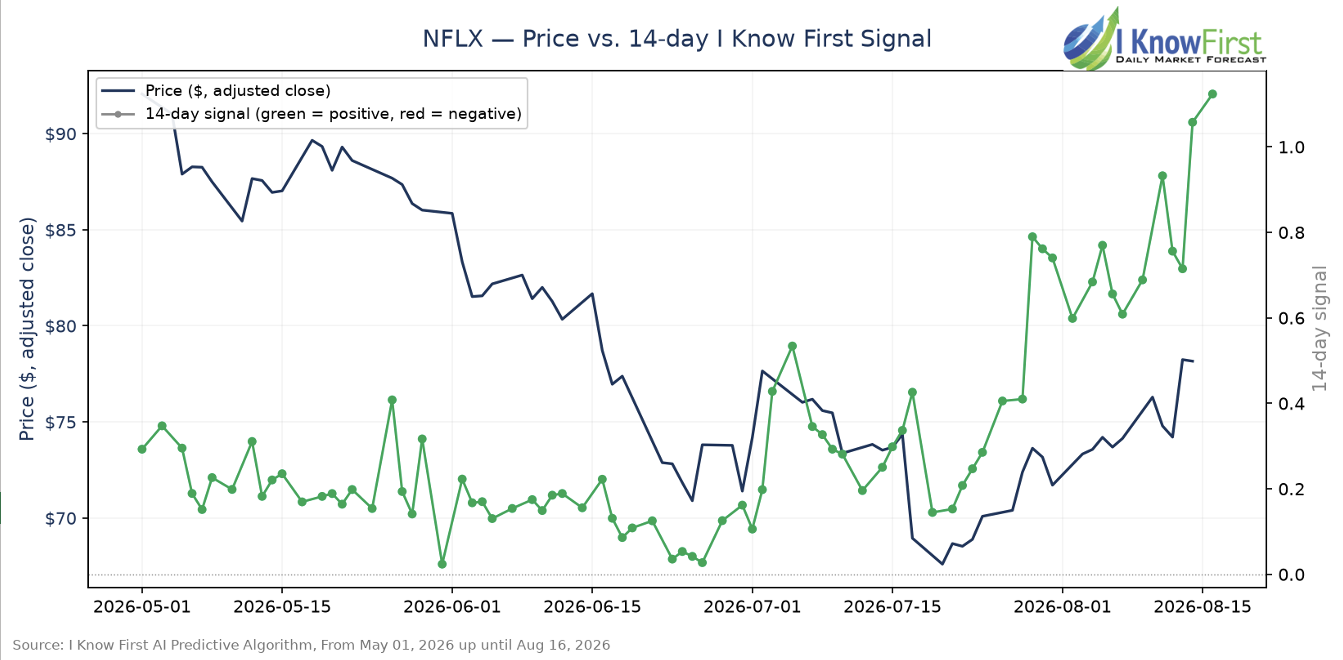
When the Signal and the Price Disagree: Netflix
The most useful thing our algorithm does is not confirm what the chart already shows. It is telling you something the chart contradicts. Netflix over the past three months is the clearest example I can give you.
Netflix: the algorithmic signal against the share price. The price falls from mid-May into July while the signal stays positive throughout, then turns higher in early July, ahead of the price.
Netflix fell from roughly $87 in mid-May to $65.08 on July 17, about 25% lower. The signal never followed it down. It stayed positive the whole way, and in early July it began climbing while the price was still falling, hitting one of its strongest readings of the period on the very session Netflix printed its low.
Netflix closed Friday at $78.16, up 20.1% from that low. One name over one stretch is an illustration rather than a track record, but the mechanism is the point: a price chart only tells you where a stock has been.
SOXX Stocks – 1 Year: Up to 681.89% Return
Our deep learning read on the semiconductor complex, up to 681.89% over a 1-year horizon, the single strongest figure across all six time horizons this week.
Top Signals This Cycle
ARK ETF Stocks Forecast (3 Days)
+14.49%
Top Technology Stocks (7 Days)
+27.91%
Quantitative Trading (14 Days)
+32.58%
Tech Stocks (1 Month)
+39.26%
Home Builders Stocks (3 Months)
+42.26%
SOXX Stocks (1 Year)
+681.89%
Bar lengths are drawn on a square-root scale so the shorter horizons remain readable alongside the 1-year figure.
Three of the six leaders are technology packages, one is an innovation-ETF basket, one is semiconductors, and one is home builders. Read that as a market still led by technology, but no longer only by technology.
The AI Portfolio Rebalances Wednesday
Since Inception – AI Portfolio
+45.37%
Since Inception – S&P 500
+37.65%
On Wednesday, August 19, our AI-Powered Portfolio rebalances and the algorithm selects ten fresh positions.
Period 18, which runs July 22 to August 19, is up 5.80% against 4.09% for the S&P 500. Microsoft was one of the names the algorithm held through that stretch, and it contributed a 27% gain. Since inception on April 2, 2025, the portfolio is up 45.37% against 37.65% for the S&P 500, a 7.72 point premium across 18 periods, every one of them tracked with no exclusions. This is a live and documented record, not a backtest.
If you join before Wednesday you start with a full fresh cycle rather than stepping into one already half run.
What the Institutions Do With the Same Signal
Two pieces published this week go under the hood, and both are worth your time if you want to understand what sits behind the daily numbers. The first sets out how hedge funds and family offices actually use these forecasts, along with the full record: 756% since January 29, 2020 against 129.1% for the S&P 500, a 39.7% compound annual growth rate, a Sharpe ratio of 1.72 and a Sortino ratio of 2.68. In 2022 the strategy gained 15.36% while the index fell 19.95%.
The second walks through the Top 10 Strategy, which reads a market regime signal continuously and decides whether to play offense or defense before it decides what to hold. From July 2020 through March 15, 2026 it returned 438.29%, exceeding the S&P 500 by 46.09 points, with a Sharpe ratio of 1.71.
And if you want the honest answer to how a model avoids fooling itself, this piece on generalization is the most candid thing we have published in a while. Fit the data too closely and you have memorized noise. Hold back too much and you have learned nothing. Everything we do sits in the tension between those two failures.
Two Ways to Stay Engaged 1. Get Daily AI Forecasts : new picks across 6 time frames, every morning. 2. AI Monthly Portfolio : 10 stocks and ETFs, rebalanced every 4 weeks. The next rebalance is Wednesday, August 19.
The algorithm is speaking again. Are you listening?
Warm regards, Yaron GolgherCEO and Co-Founder, I Know First
Past performance is not indicative of future results. All investments involve risk. Short selling and options trading carry significant risks and are not suitable for all investors. I Know First forecasts are algorithmic signals intended to supplement, not replace, independent investment analysis and professional financial guidance.
I Know First
Most Popular Package Of The Week
Top 10 Stocks Forecast Package
Includes daily forecasts for:
Top Implied Volatility Stock Forecast for long and short positions.
6 time ranges: 3 days, 7 days, 14 days, 1 month, 3 months and 1 year
Investment universe: Energy Sector
Check some recent forecasts' performances: 7 Days, and 1 Year!
Apple has opened its Advanced Manufacturing Center in Houston, Texas, a 20,000 square foot facility that builds AI servers and will assemble Mac mini units, offering free assembly training to small and medium businesses as part of the company's $600 billion commitment to US manufacturing. For 2027, the iPhone's 20th anniversary, Apple is proceeding with a glass-centric redesign for the Pro and Pro Max, front and back glass with a thin metal band around the edge, after an all-glass prototype was abandoned in development. Leaked screen protectors also point to a foldable iPhone Ultra with asymmetric corners around the hinge, a 5.5 inch outer and 7.8 inch inner display, the A20 Pro chip and a 5,000mAh battery, with a September launch expected above $2,000.